Earnings Summary
The Fiscal Year Ended March 31, 2026
Financial results
| FY2025 | FY2026 | Change | |
|---|---|---|---|
| Net sales | 127,387 | 180,642 | +53,255 |
| Operating profit | 13,781 | 29,282 | +15,501 |
| Ordinary profit | 15,328 | 31,291 | +15,962 |
| Profit attributable to owners of parent |
10,906 | 15,733 | +4,826 |
Quarterly results
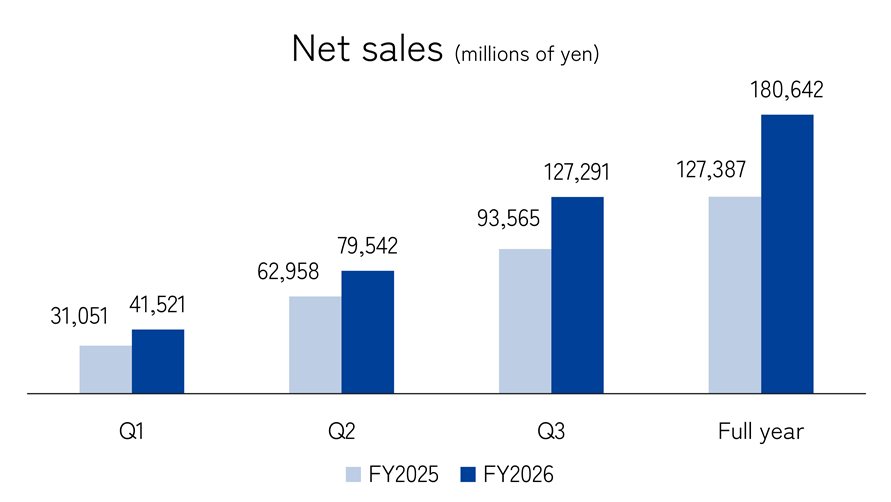
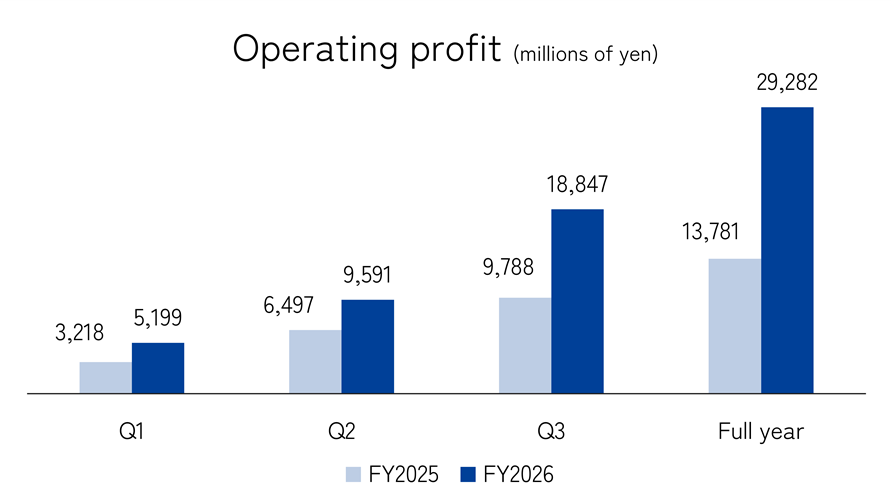
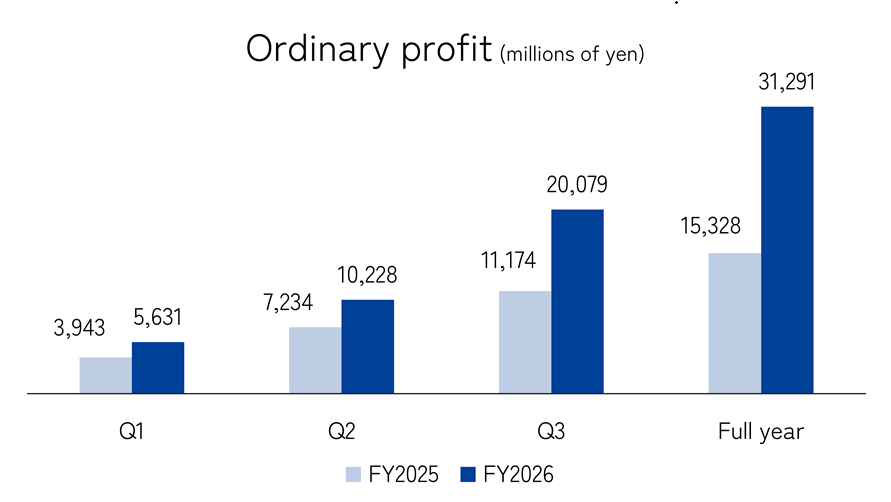
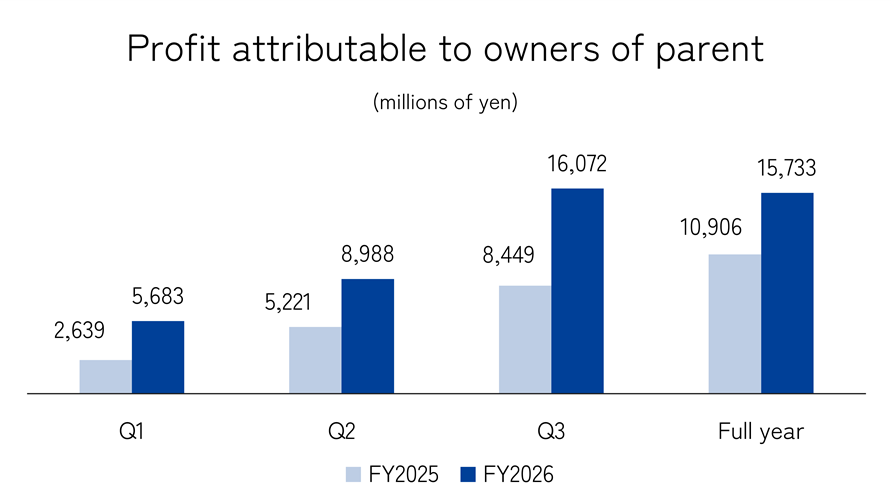
Net sales for the fiscal year ended March 31, 2026 increased by ¥53,255 million (41.8%) from the previous fiscal year, to ¥180,642 million. Operating profit increased by ¥15,501 million (112.5%) from the previous fiscal year, to ¥29,282 million, and ordinary profit increased by ¥15,962 million (104.1%) from the previous fiscal year, to ¥31,291 million. In addition, profit attributable to owners of parent increased by ¥4,826 million (44.3%) from the previous fiscal year, to ¥15,733 million.
Net sales by segment
| FY2025 | FY2026 | Change | |
|---|---|---|---|
| Robotic Solutions | 114,157 | 168,737 | +54,580 |
| Machine Tools | 11,093 | 9,705 | -1,388 |
| Other businesses | 2,136 | 2,199 | +63 |
| Total | 127,387 | 180,642 | +53,255 |
- Robotic Solutions
In the Asian region, particularly in Thailand and India, demand for AI server-related equipment remained at a high level,and demand for semiconductor-related equipment, including die bonders, also grew. As a result, net sales for the segment increased by ¥54,580 million (47.8%) from the previous fiscal year, to ¥168,737 million. Operating profit increased by ¥17,273 million (105.7%) from the previous fiscal year, to ¥33,623 million.
- Machine Tools
Demand for automotive sector equipment remained sluggish, and sales volumes declined significantly, particularly in the North American market. As a result, net sales for the segment decreased by ¥1,388 million (12.5%) from the previous fiscal year, to ¥9,705 million, and operating loss was ¥107 million (operating profit for the previous fiscal year was ¥740 million).
Financial position
| FY2025 | FY2026 | Change | |
|---|---|---|---|
| Total assets | 244,289 | 278,356 | +34,067 |
| Net assets | 218,682 | 232,454 | +13,772 |
| Equity ratio | 89.5% | 83.5% | -6.0pt |
- Assets
The current assets as of March 31, 2026 was ¥195,507 million, an increase of ¥40,079 million from the end of the previous fiscal year. This is mainly because notes and accounts receivable-trade increased by ¥30,543 million and inventories increased by ¥10,914 million. Non-current assets decreased of ¥6,012 million compared with the end of the previous fiscal year, to ¥82,849 million. This is mainly because goodwill decreased by 8,087 million due to the recognition of impairment losses on goodwill related to our subsidiary, Fasford Technology Co., Ltd., while retirement benefit asset increased by 2,048 million.As a result, total assets increased by ¥34,067 million from the end of the previous fiscal year, to ¥278,356 million.
- Liabilities
The current liabilities as of March 31, 2026 was ¥43,382 million, an increase of ¥21,126 million from the end of the previous fiscal year. This is mainly because income taxes payable increased by ¥7,440 million, notes and accounts payable-trade increased by ¥6,977 million, and advance received and deposits received (included in “Other” in current liabilities) increased by ¥5,482 million. Non-current liabilities decreased by ¥831 million compared with the end of the previous fiscal year, to ¥2,519 million. This is mainly because deferred tax liabilities decreased by ¥1,052 million.As a result, total liabilities increased by ¥20,295 million from the end of the previous fiscal year, to ¥45,902 million.
- Net assets
The total net assets as of March 31, 2026 was ¥232,454 million, an increase of ¥13,772 million from the end of the previous fiscal year. This is mainly because retained earnings increased by ¥15,733 million due to profit attributable to owners of parent and foreign currency translation adjustment increased by 4,187 million due to the continuing weak yen in exchange markets, while retained earnings decreased by ¥7,075 million due to payment of dividends.As a result, equity ratio as of March 31, 2026 was 83.5% (89.5% at the end of the previous fiscal year).
FY2027 forecast
| FY2026 | FY2027 | Change | |
|---|---|---|---|
| Net sales | 180,642 | 211,000 | +30,357 |
| Operating profit | 29,282 | 43,600 | +14,317 |
| Ordinary profit | 31,291 | 44,300 | +13,008 |
| Profit attributable to owners of parent |
15,733 | 33,000 | +17,266 |
Full-year sales forecast by segment
| FY2026 | FY2027 | Change | |
|---|---|---|---|
| Robotic Solutions | 168,737 | 200,000 | +31,262 |
| Machine Tools | 9,705 | 9,000 | -705 |
| Others | 2,199 | 2,000 | -199 |
| Total | 180,642 | 211,000 | +30,357 |


Facing challenges drives the future.
DNA that never stops evolving.
Human stories woven through technology.