Climate Change Measures: Goals and Results
Medium- and long-term environmental targets
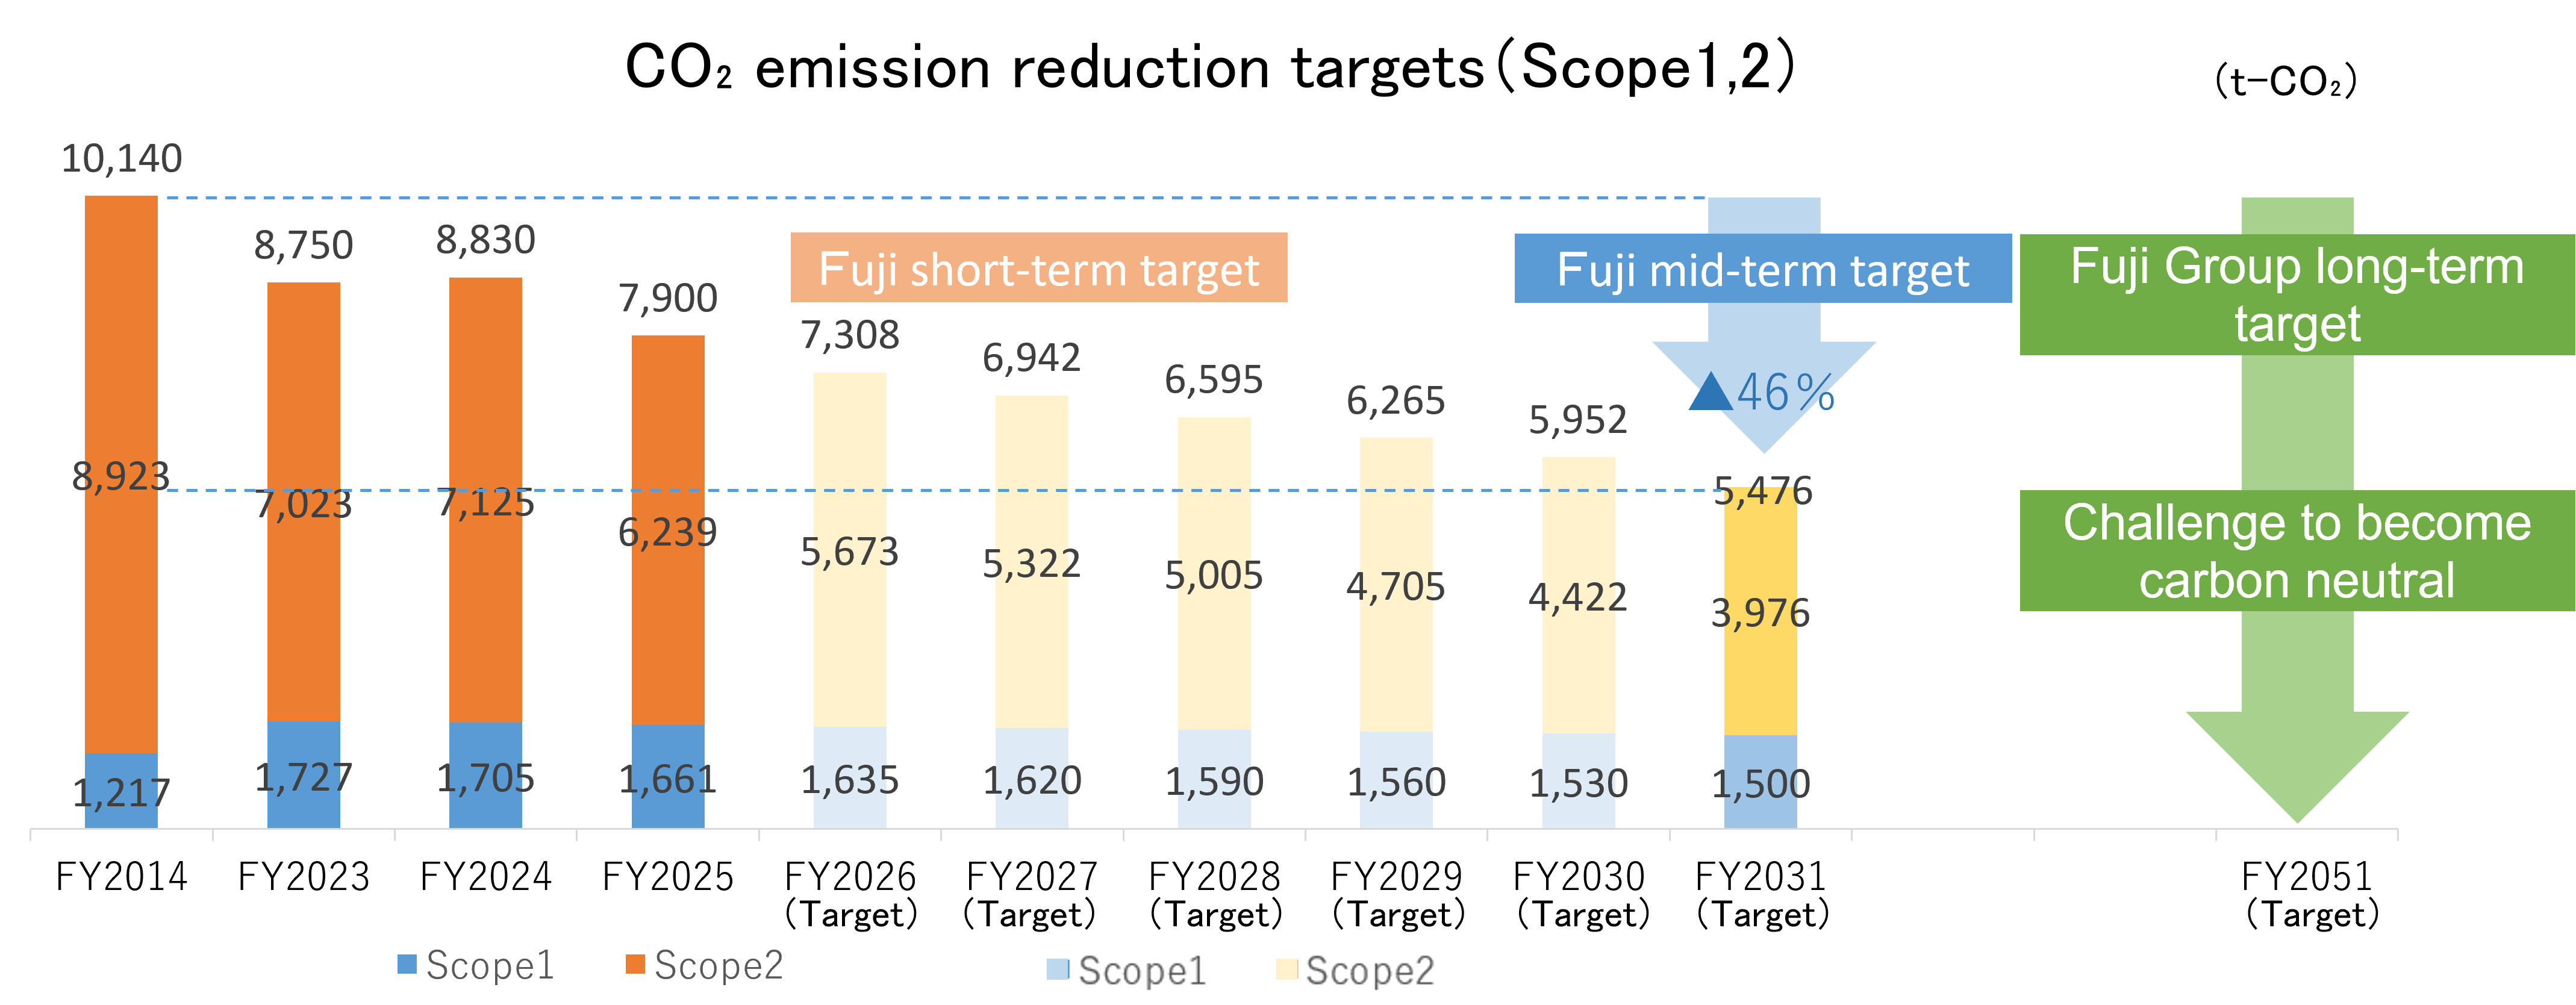
We have been working to combat climate change, with the medium-term target of reducing CO2 emissions by 46% from the fiscal 2014 level by fiscal 2031. In April 2023, the Sustainability Promotion Committee established the Fuji Group's long-term goals and strategic roadmap for achieving carbon neutrality, as we are strongly aware that the preservation of the global environment is one of the most important issues shared by all humankind. We will address climate change throughout the entire Group and supply chain.
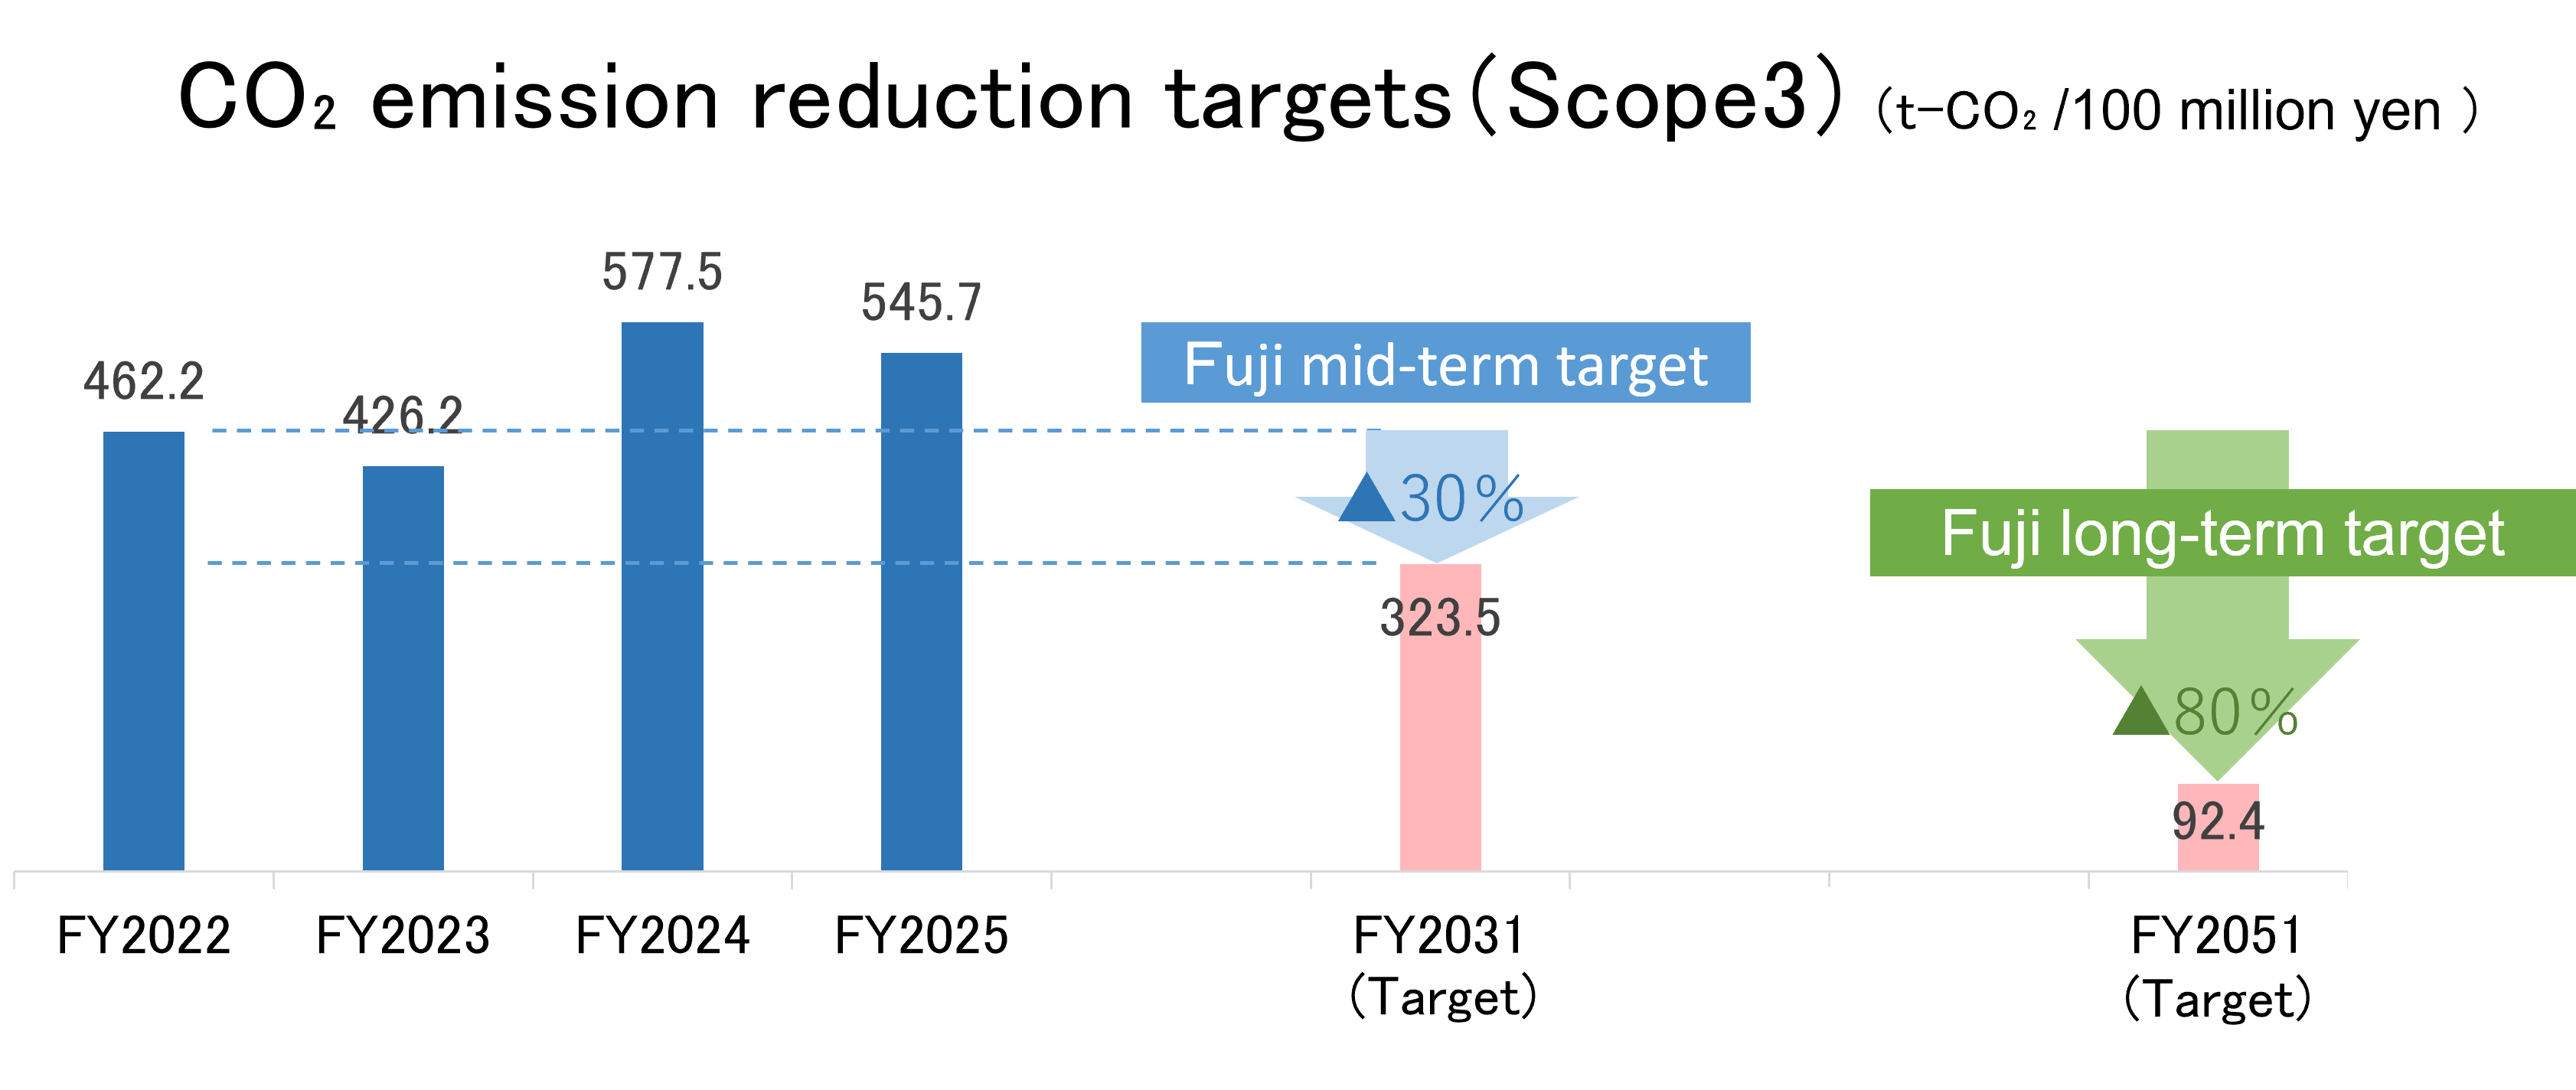
Especially in scope 3, we will calculate emissions and reduce CO2 emissions across the entire Fuji Group.
- Fuji Group long-term targets
-
- Scope 1, 2※ : Challenge to become carbon neutral by 2051
- Fuji medium-term targets
-
- Scope 1, 2※ : Reduce CO2 emissions by 46% (compared to fiscal 2014) by fiscal 2031
- ※Scope 1: Direct emissions by in-house fuel consumption
- ※Scope 2: Indirect emissions by in-house use of electricity and heat
- Fuji long-term targets
-
- Scope 3※ : Reduce CO2 emissions for net sales per unit by 80% (compared to fiscal 2022) by 2051
- Fuji medium-term targets
-
- Scope 3※ : Reduce CO2 emissions for net sales per unit by 30% (compared to fiscal 2022) by 2031
- ※Scope 3: Emissions of other companies generated in the value chain such as material procurement, logistics, and sales related to our business activities other than those of scopes 1 and 2.
CO2 emission results
| Scope / Category | CO2 emission FY2022 Investigation |
CO2 emissions Investigation FY2022 |
CO2 emissions Investigation FY2023 |
CO2 emissions Investigation FY2024 |
CO2 emissions Investigation FY2025 |
Calculation method |
|---|---|---|---|---|---|---|
| Total (Scope1 + Scope2 + Scope3) | 543,137 | 509,754 | 549,051※1 | 527,231※1 | 507,615 | |
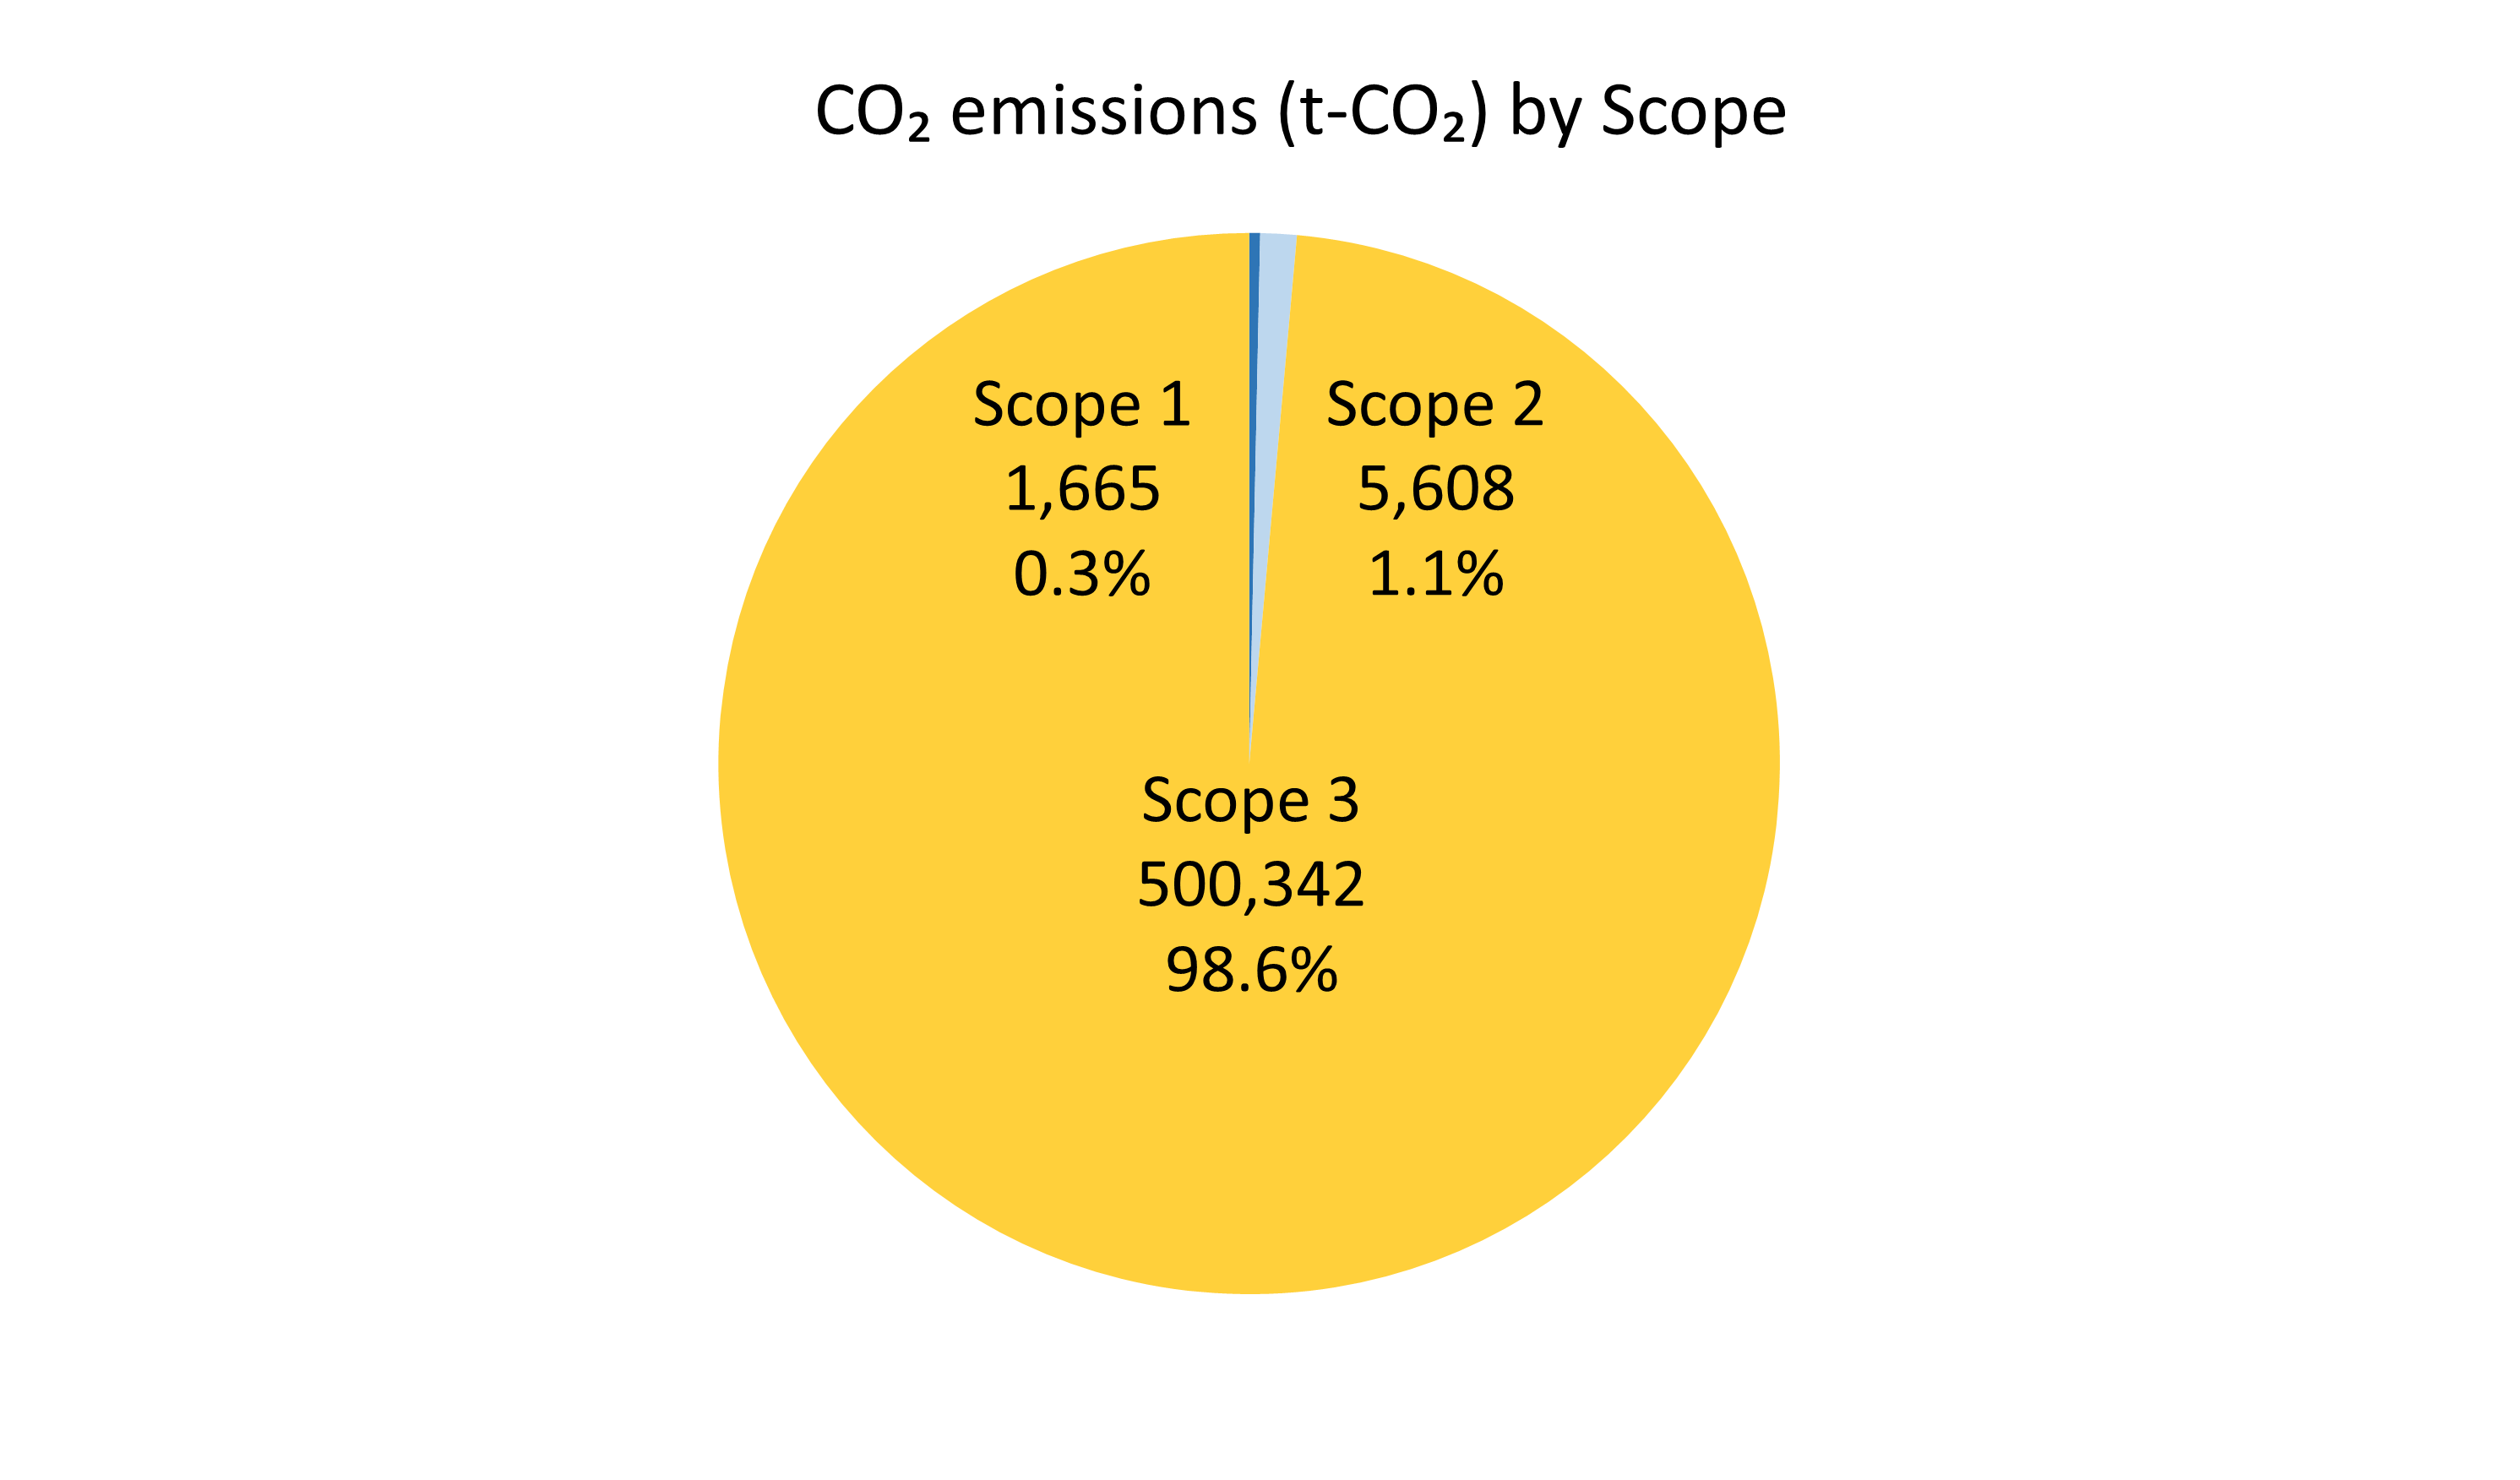
| Scope1 | 1,973 | 1,727 | 1,705 | 1,661 | 1,665 | |
| Scope2 Market-based approach | 6,891 | 7,023 | 7,125 | 6,239 | 5,608 | |
| Scope2 Location-based approach | - | 10,081 | 7,528 | 6,964 | 7,448 | |
| Scope3 | 534,273 | 501,004 | 540,221※1 | 519,331 | 500,342 | |
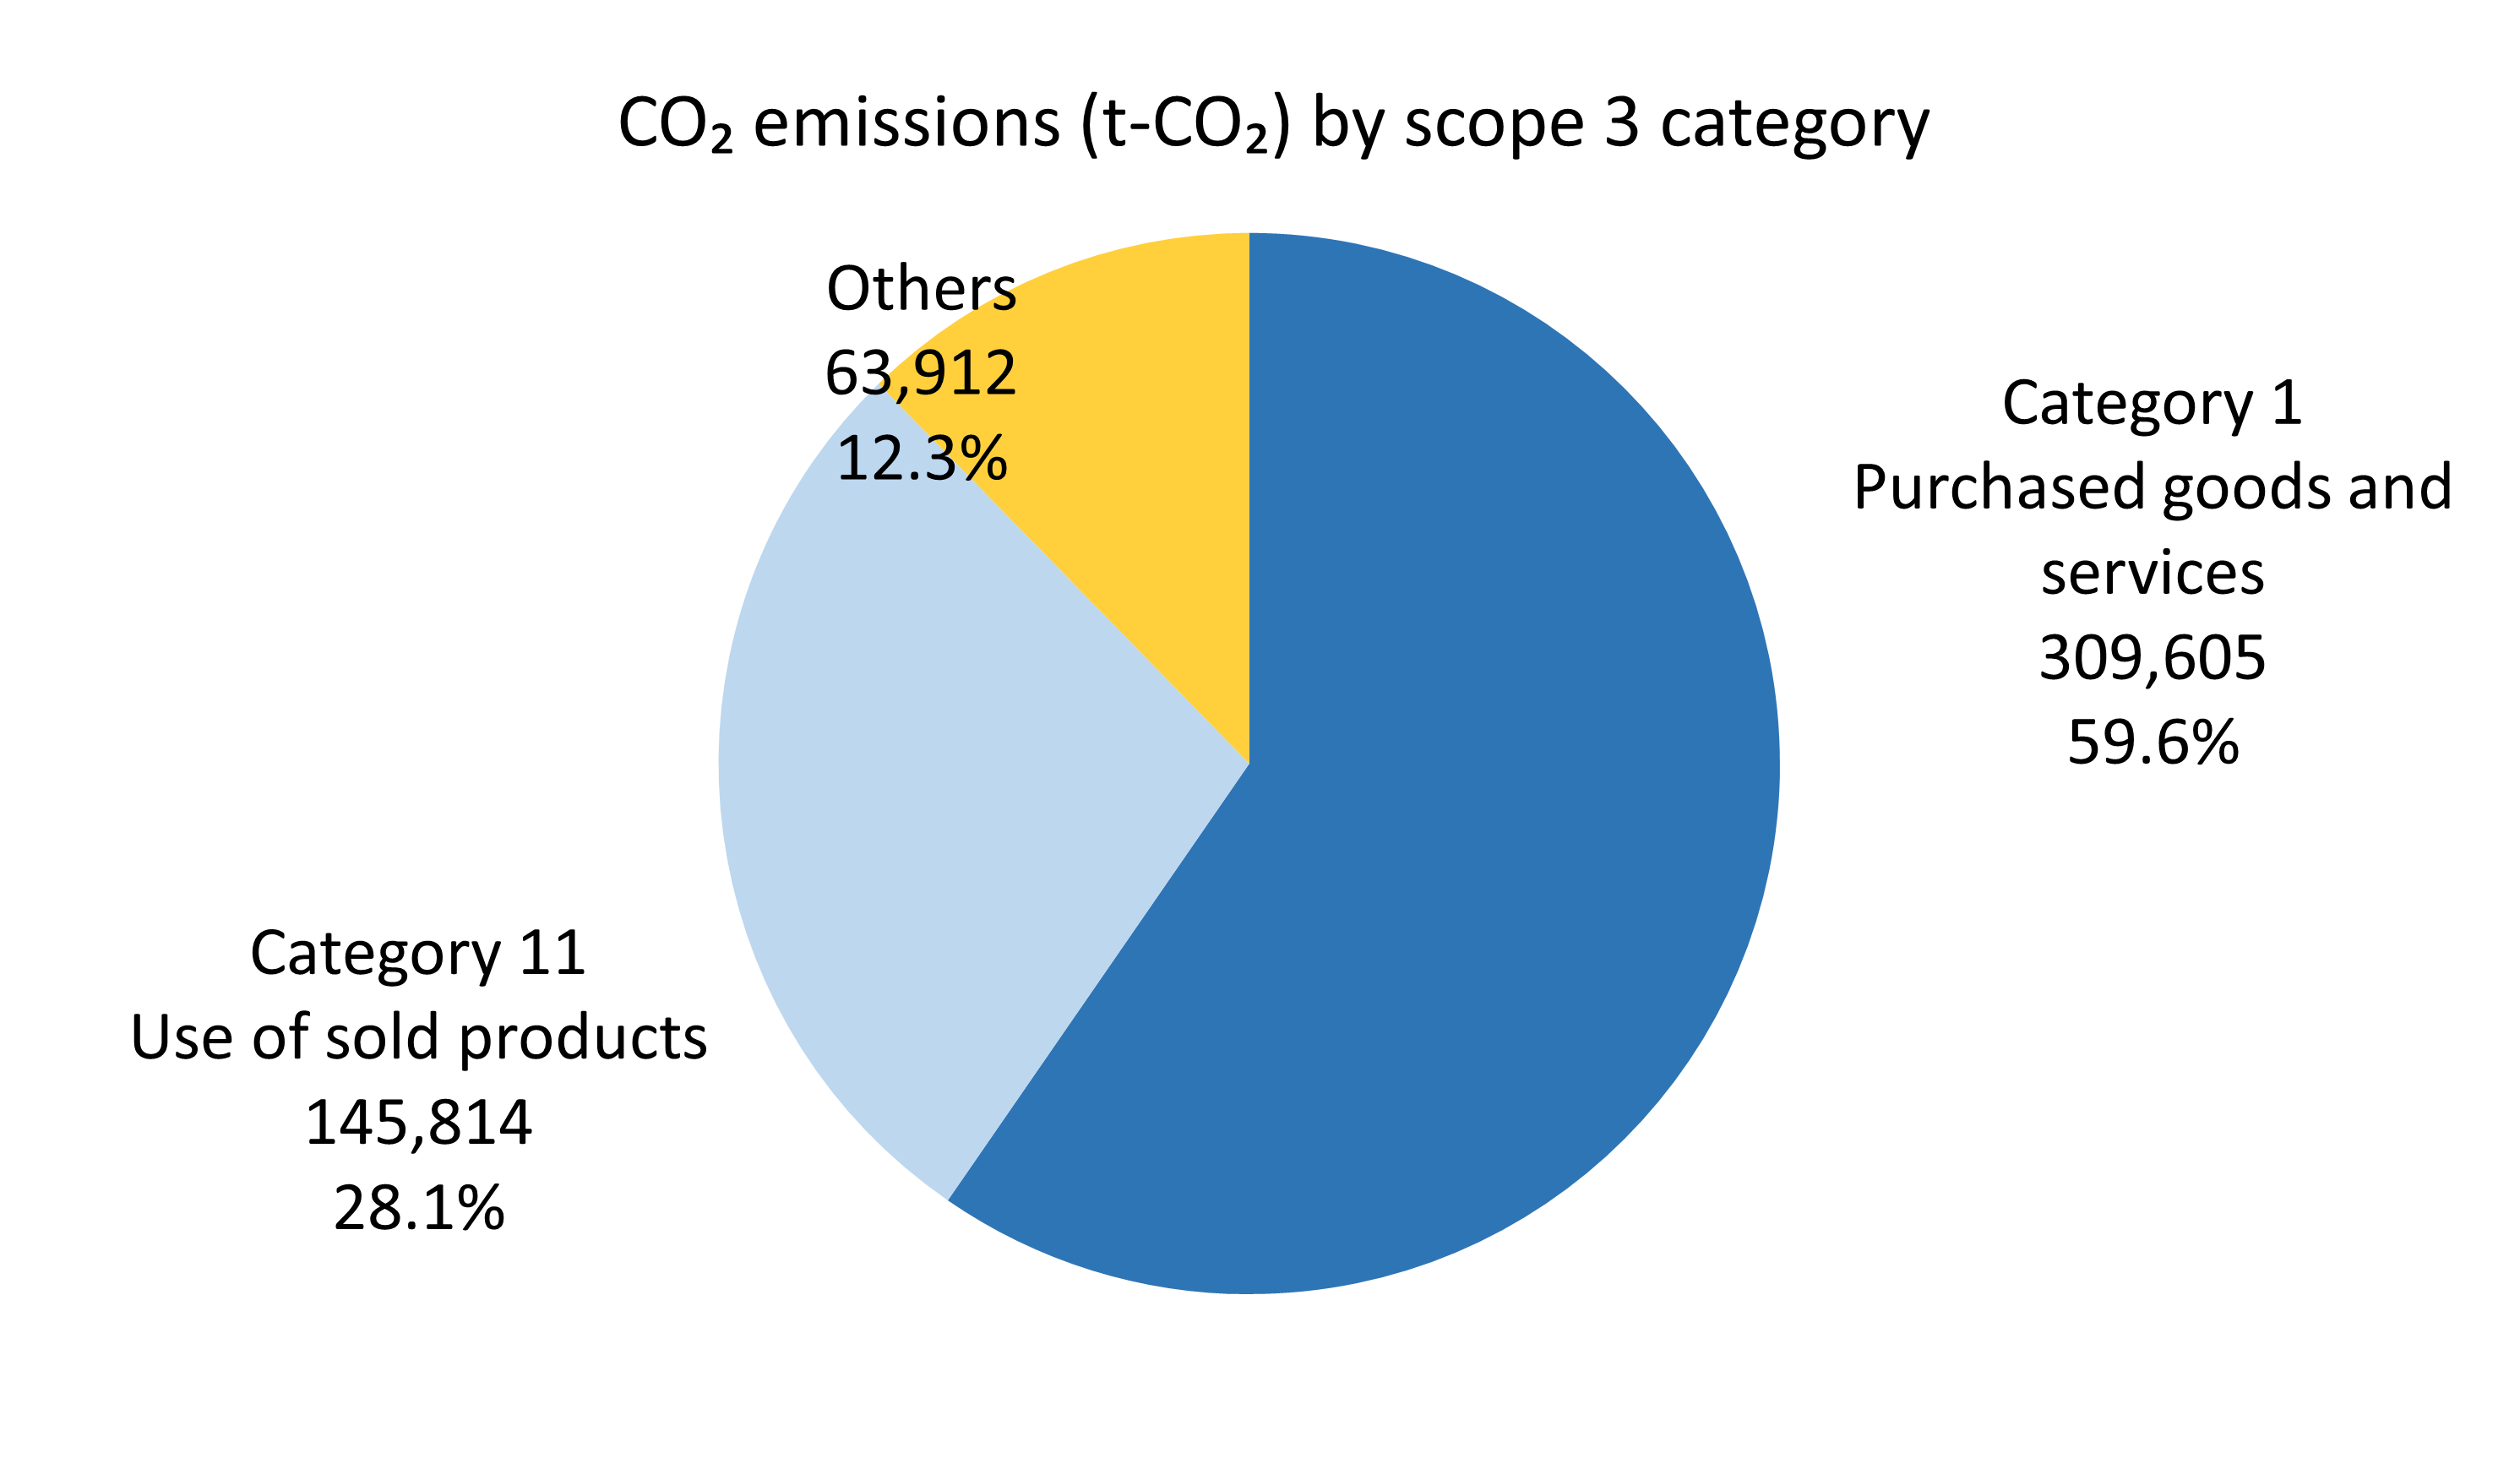
| C1. Purchased goods and services | 308,836 | 299,001 | 381,797※1 | 309,605 | 307,538 | Calculated by applying emissions intensity metrics to the amount and value of goods purchased from suppliers. |
| C2. Capital goods | 30,976 | 22,468 | 24,723 | 57,191 | 30,374 | Calculated by applying per capital good intensity metrics to the fixed asset acquisition value. |
| C3. Fuel and energy related activities not included in scope 1 or scope 2 | 8,288 | 9,351 | 1,454 | 1,425 | 1,269 | Calculated by applying emissions intensity metrics to energy consumption (such as electricity and fuel). |
| C4. Upstream transportation and distribution | - | 4,631 | 6,078 | 2,395 | 2,984 | Calculated by applying emission intensity metrics to the transportation distance that was estimated based on the addresses of suppliers and delivery locations. |
| C5. Waste generated in operations | 96 | 133 | 251 | 118 | 131 | Calculated by applying emissions intensity metrics to the emissions for each waste type. |
| C6. Business travel | 450 | 542 | 798 | 781 | 891 | Calculated by applying emissions intensity metrics based on the days traveled. |
| C7. Employee commuting | 1,003 | 975 | 1,018 | 1,058 | 1,084 | Calculated by applying emissions intensity metrics based on the normal number of employees in commute. |
| C8. Upstream leased assets | 619 | 938 | 1,015 | 912 | 1,273 | Calculated by applying emissions intensity metrics to the floor area of the leased property. |
| C9. Downstream transportation and distribution | - | - | - | - | - | Under investigation |
| C10. Processing of sold products | - | - | - | - | - | Not applicable |
| C11. Use of sold products | 183,974 | 162,929 | 123,056 | 145,814 | 154,755 | Calculated by applying emissions intensity metrics to the lifetime energy consumption (assuming 7 years of use) for the annual sales volume of the NXT III SMT pick and place machine and the CSD II front-facing twin spindle lathe, which are the main products of each business division. |
| C12. End-of-life treatment of sold products | 31 | 38 | 31 | 32 | 43 | Calculated by classifying the materials that configure packing materials for the NXT III SMT pick and place machine and the CSD II front-facing twin spindle lathe, which are the main products of each business division, and by applying emissions intensity metrics to the annual sales volume of these. |
| C13. Downstream leased assets | - | - | - | - | - | Not applicable |
| C14. Franchises | - | - | - | - | - | Not applicable |
| C15. Investments | - | - | - | - | - | Not applicable |
- A portion of the CO2 emissions data was revised due to an error(July 2026).


Facing challenges drives the future.
DNA that never stops evolving.
Human stories woven through technology.